Recession Risk and the Assets Built for It
A source-led look at recession risk, medical outpatient real estate, bonds, commodities and dividend quality—and the conditions that could break each thesis.
- Topic
- Market power
- Published
- Updated
- Reading time
- 6 min read

The S&P 500 fell 4.6% in the first quarter of 2026, its fifth consecutive losing week. The Dow entered correction territory. Economists now place the probability of a U.S. recession at 29–40%, up from 15% six months ago. Oil prices near $100, multi-year-high interest rates, and geopolitical tensions in the Middle East are the usual suspects. Yet the assets most often cited as defensive — real estate, bonds, and commodities — are not behaving like simple safe havens. They are behaving like assets with their own supply constraints, demographic tailwinds, and structural resilience.
The Recession That Keeps Not Arriving
Recession probabilities have been rising for two years, but the economy has not cooperated. The term "rolling recession" has become shorthand for a series of sector-specific downturns — retail, office, regional banks — that never coalesce into a broad contraction. The latest GDP print showed 2.1% annualized growth, above the long-term trend. The Bureau of Labor Statistics reported June 2026 unemployment of 4.2%. Consumer spending, adjusted for inflation, is still expanding, albeit at a slower pace.
The Federal Reserve's rate hikes began in March 2022, and the yield curve inverted shortly after. Since then, every quarter has brought a new round of recession forecasts with higher implied certainty. The forecasts are not wrong; they are not timely. The lags between monetary policy and economic activity are longer than most models assume, and the transmission mechanism is weaker when households and corporations have locked in low fixed-rate debt.
The S&P 500's forward price-to-earnings ratio has compressed from 22x to 17x over the past year, but earnings estimates have not yet been revised downward. The compression is entirely due to multiple contraction, not deteriorating fundamentals — which suggests the market is pricing in a recession premium, not a recession itself.
Real Estate's Demographic Moat
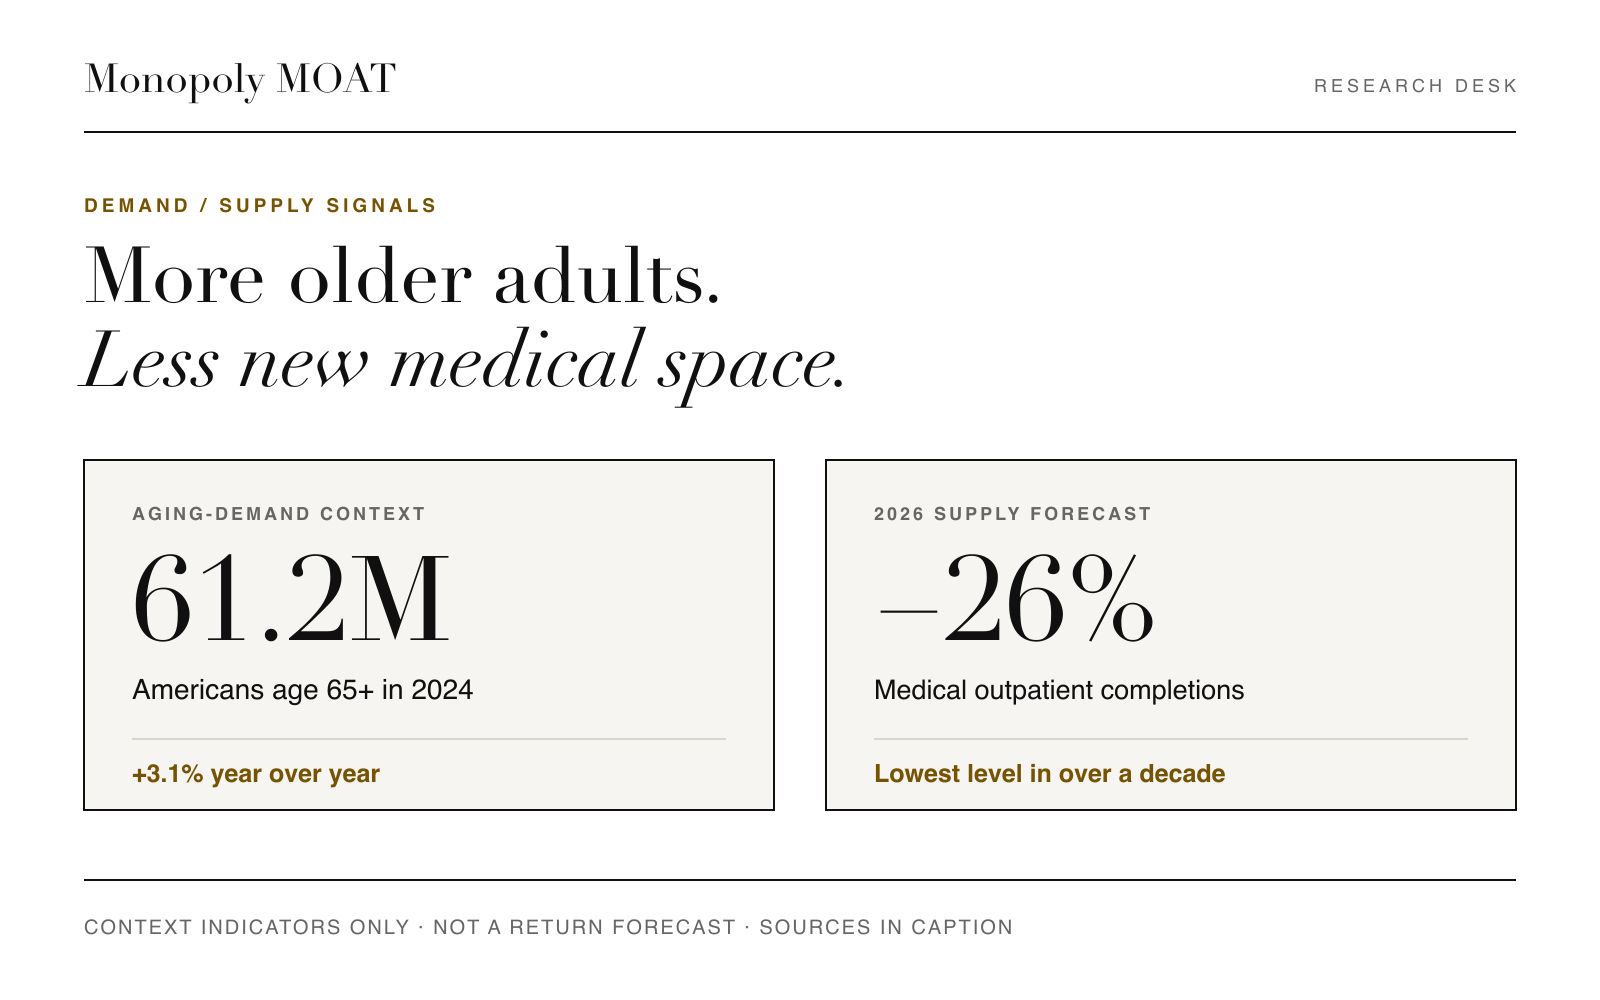
Medical outpatient demand is influenced by structural factors as well as the business cycle. The U.S. Census Bureau estimated that 61.2 million Americans were age 65 or older in 2024, up 3.1% from 2023. CBRE projects the population aged 65–84 to grow 17% and the population aged 85 or older to grow 56% by 2034. Those demographics support a healthcare-demand thesis; they do not guarantee returns for every property or fund.
Supply is also tightening, but the measure and period matter. CBRE says medical outpatient building completions declined in 2025 and forecasts a further 26% decline in 2026, which would put completions at their lowest level in more than a decade. This supports a constrained-supply thesis for medical outpatient buildings—not a blanket claim that medical office, seniors housing and student housing will all outperform.
One large transaction illustrates the sector’s scale and need for specialized operations. In October 2025, Remedy Medical Properties and Kayne Anderson Real Estate announced a transaction covering approximately 18 million square feet across 296 properties in 34 states. Welltower valued the disposition at approximately $7.2 billion, reported 94% occupancy and said the assets would be sold in multiple tranches through mid-2026. Remedy assumed operations and added 170 former Welltower employees, expanding its team beyond 500. Welltower retained preferred equity and a profits interest. These disclosures illustrate scale and specialization; they do not establish a bargain purchase or guaranteed defensive returns.
What the Bond Market Was Signaling
At the article’s publication point, the Treasury curve did not match the original description. On July 24, 2026, the 10-year Treasury yield was 4.69% and the 2-year yield was 4.33%, leaving the 10s–2s curve positively sloped by 36 basis points—not inverted. The 10-year yield began the year at 4.19%, not 3.8%. Sources: Federal Reserve 10-year series, 2-year series and 10s–2s spread.
Higher yields improve prospective income for new buyers but generally mean lower prices for existing bonds. It is therefore inaccurate to describe a period of rising yields simply as a bond rally.
The Federal Reserve’s June projections showed a median 2026 year-end federal-funds rate of 3.8%, close to the prevailing target range of 3.50%–3.75%. That was not a clear promise of one or two cuts. Rate paths are forecasts and can change with inflation, employment and financial conditions. Federal Reserve projections.
Broad investment-grade bonds can still provide income, liquidity and diversification, but they carry duration and credit risk and are not guaranteed to rally during an equity decline.
Commodities as a Geopolitical Hedge
Oil prices near $100 are a tax on consumers and a tailwind for energy producers. Gold has rallied to record highs, driven by geopolitical tensions in the Middle East and Asia. The two assets are often inversely correlated, but in 2026 they have risen together — an unusual alignment that reflects a market pricing in both inflation and geopolitical risk simultaneously.
The demand driving commodities is structural, not purely speculative. The energy transition requires copper, lithium, and rare earth metals, all in short supply. The U.S. strategic petroleum reserve is being refilled after years of drawdowns. Gold, long treated as a relic, now functions as a hedge against currency debasement and geopolitical instability. Combining commodities with bonds in a single allocation provides diversification and income while hedging against both inflation and geopolitical disruption — a design that fits the current environment more naturally than most tactical repositioning.
The Dividend Quality Trade
Dividend sustainability matters more than headline yield during periods of macro uncertainty. Companies with strong balance sheets, consistent cash flow, and a track record of dividend growth tend to hold up better in downturns — and that quality screen has gained traction as recession fears have risen.
The energy sector illustrates the logic. Oil prices near $100 have boosted profits for producers, but the sector's resilience owes as much to capital discipline as to price. After years of overspending, energy companies are returning cash to shareholders through dividends and buybacks, which has made their payout profiles more durable across the cycle. Healthcare and consumer staples follow a similar pattern: lower cyclicality, more sustainable income streams, with the tradeoff being below-average sensitivity to any recovery rally.
The risk is real. Elevated interest rates can make high-dividend stocks look less attractive relative to fixed income, and a deeper-than-expected recession could force dividend cuts even among financially strong companies. For portfolios that assume a mild downturn or no downturn at all, dividend quality stocks offer income while waiting for the macro picture to clarify.
The Mild-Recession Thesis and Its Failure Conditions
The mild-slowdown thesis depends on employment and spending remaining resilient while credit conditions avoid a disorderly tightening. The Bureau of Labor Statistics reported a 4.2% unemployment rate for June 2026. Fixed-rate debt may cushion some borrowers from higher rates, but that protection is uneven and does not remove refinancing, credit or income risk. The Federal Reserve’s June projections also did not guarantee rate cuts. These are conditions to monitor—not assurances that a downturn would be shallow.
A geopolitical or energy shock could weaken growth while sustaining inflation, limiting the protection available from nominal bonds. Medical outpatient real estate, investment-grade bonds, gold and dividend stocks also retain their own valuation, liquidity, duration and operating risks. None is guaranteed to hold up in a severe downturn.
A soft landing and a contraction would favor different exposures. The practical conclusion is therefore not that any asset is “built” to win in every outcome, but that identifiable demand, supply and cash-flow drivers can help investors understand which risks they are accepting.
Correction — 6 September 2026: an earlier sentence misstated the unemployment rate. The BLS release of 2 July 2026 reported 4.2% unemployment for June 2026. The original publication date is unchanged.
Research briefing
Get new Monopoly MOAT research by email.
New analysis and publication updates, sent when they are published.
Discussion